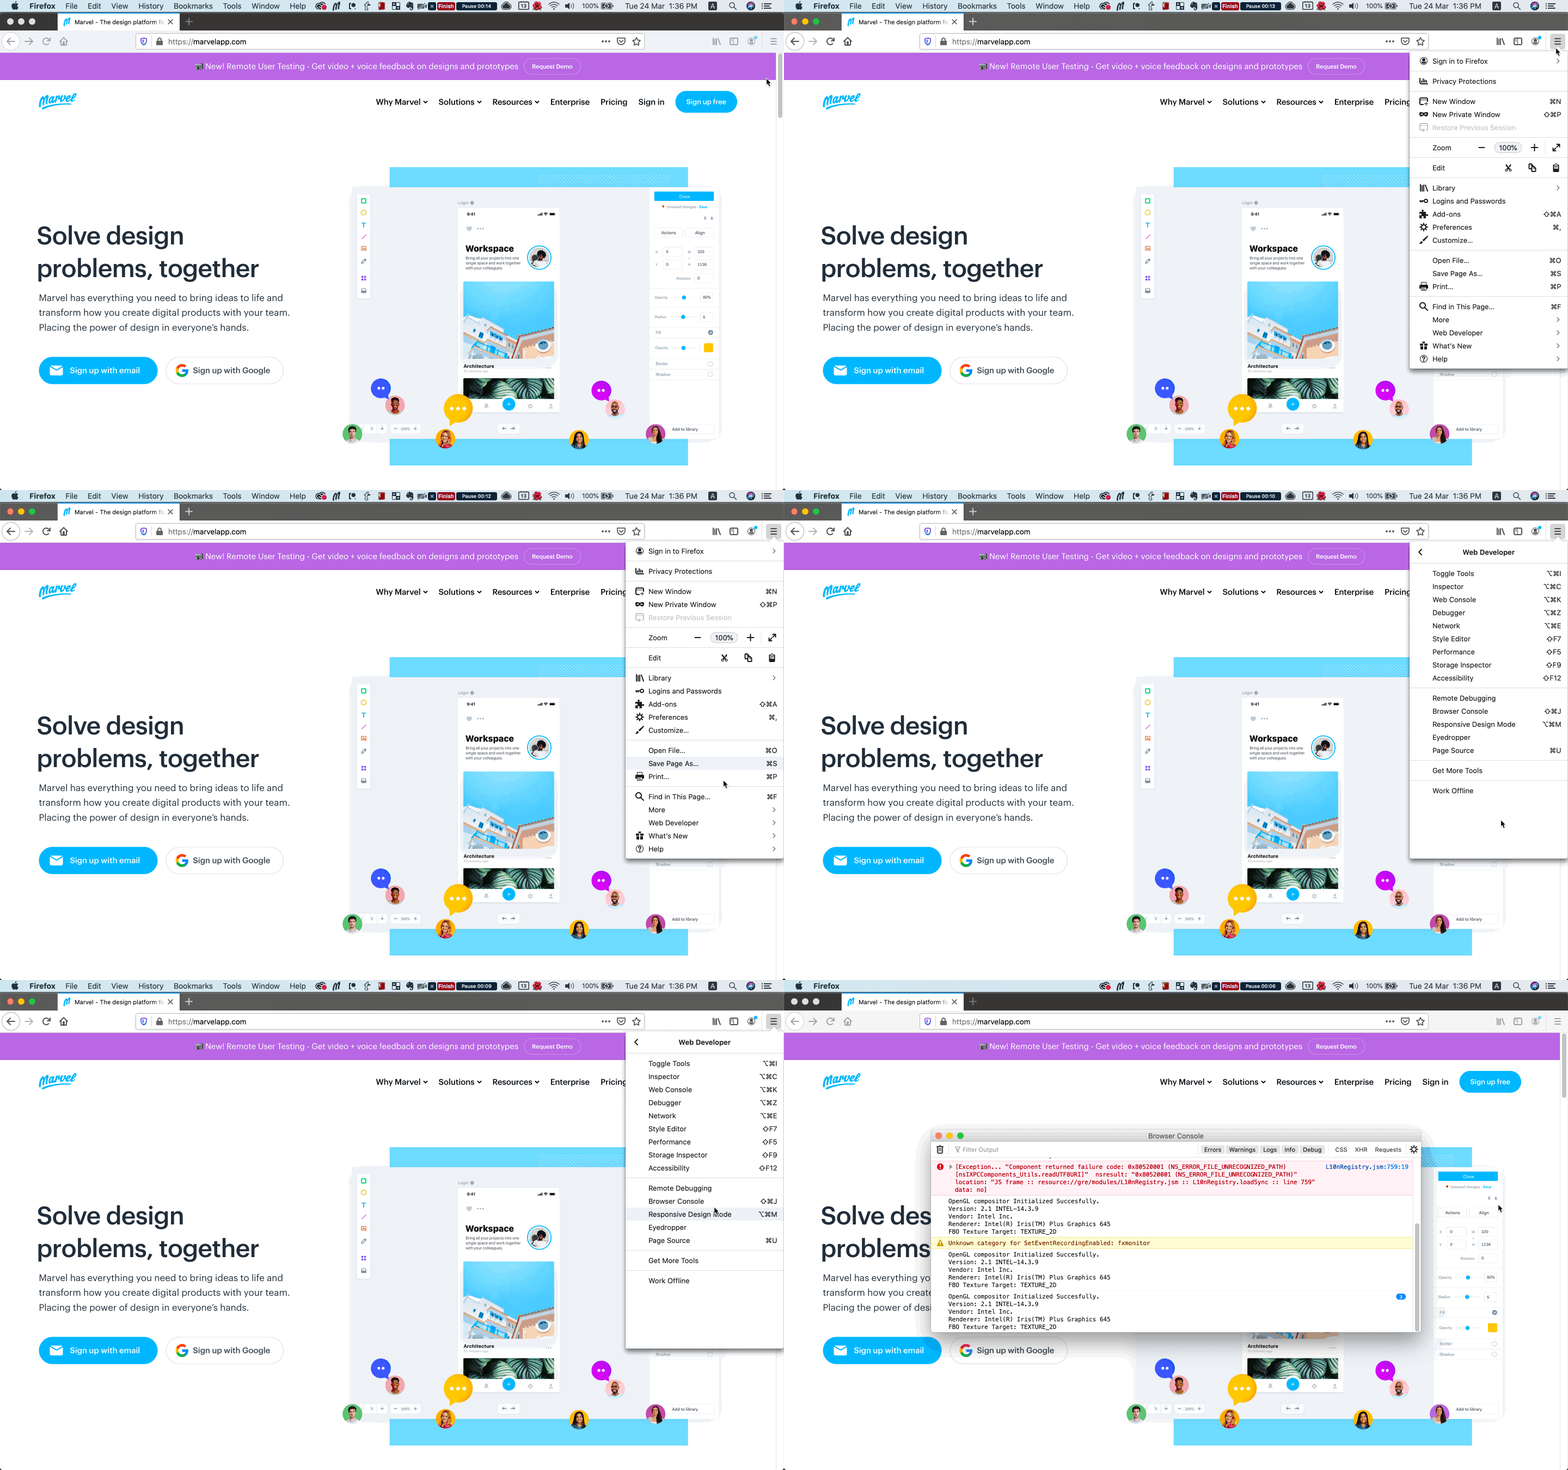
Our Marvel App Support Team may ask for a screenshot or screen recording of your console information while troubleshooting issues you may be facing.
What is the developer console?
The developer console logs website info helps our developers fix any issues quickly. It is available in every web browser.
Here are step-by-step guides for each browser:
How to open the developer console in Chrome
To open the developer console window on Chrome, use the keyboard shortcut Cmd + Shift + J (on Windows) or Cmd + Option + J (on Mac).
OR
Go to the Chrome toolbar > View > Developer > Javascript Console.
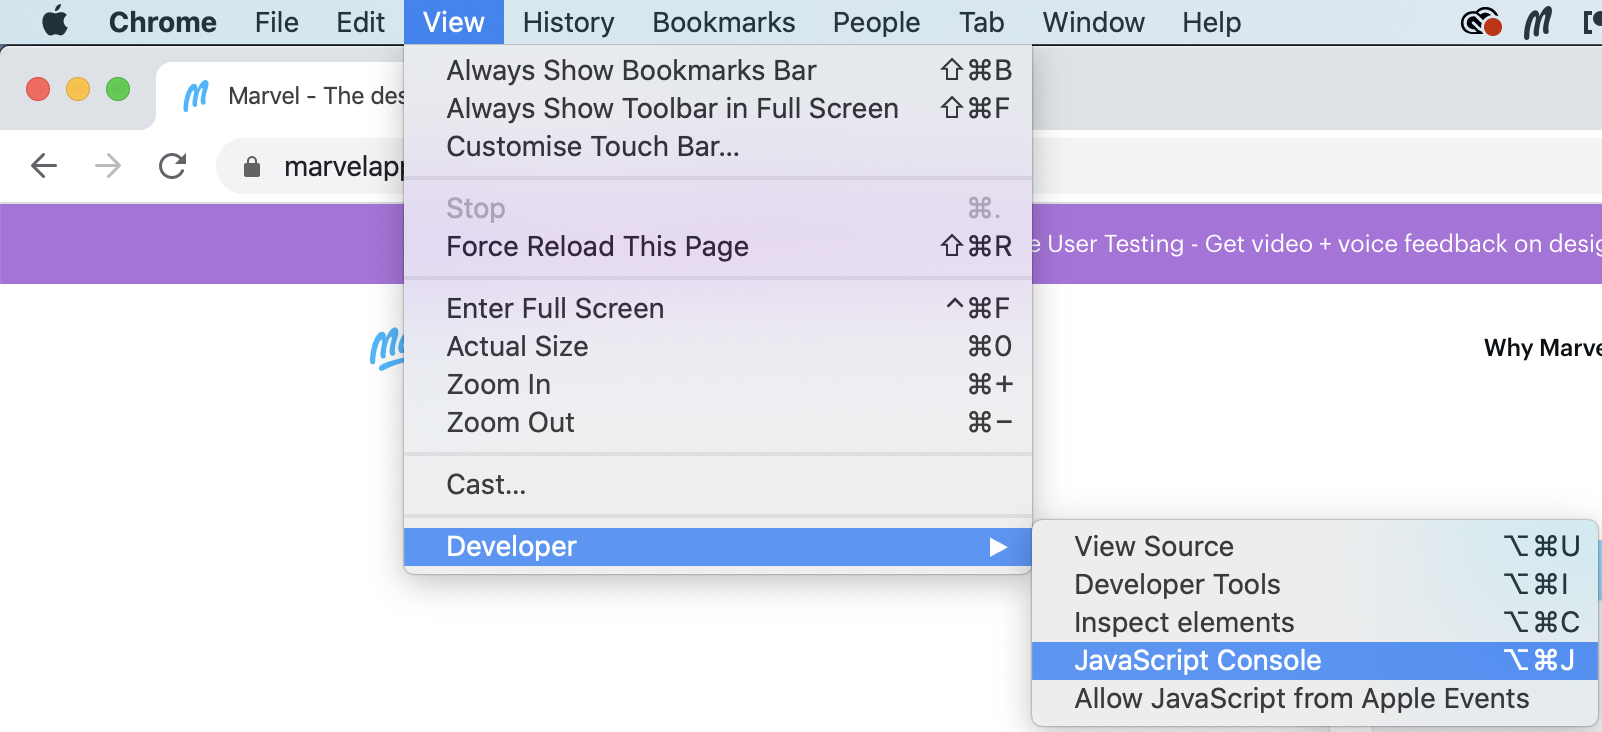
OR
Go to the Chrome Menu (upper right hand corner) > More Tools > Developer Tools.
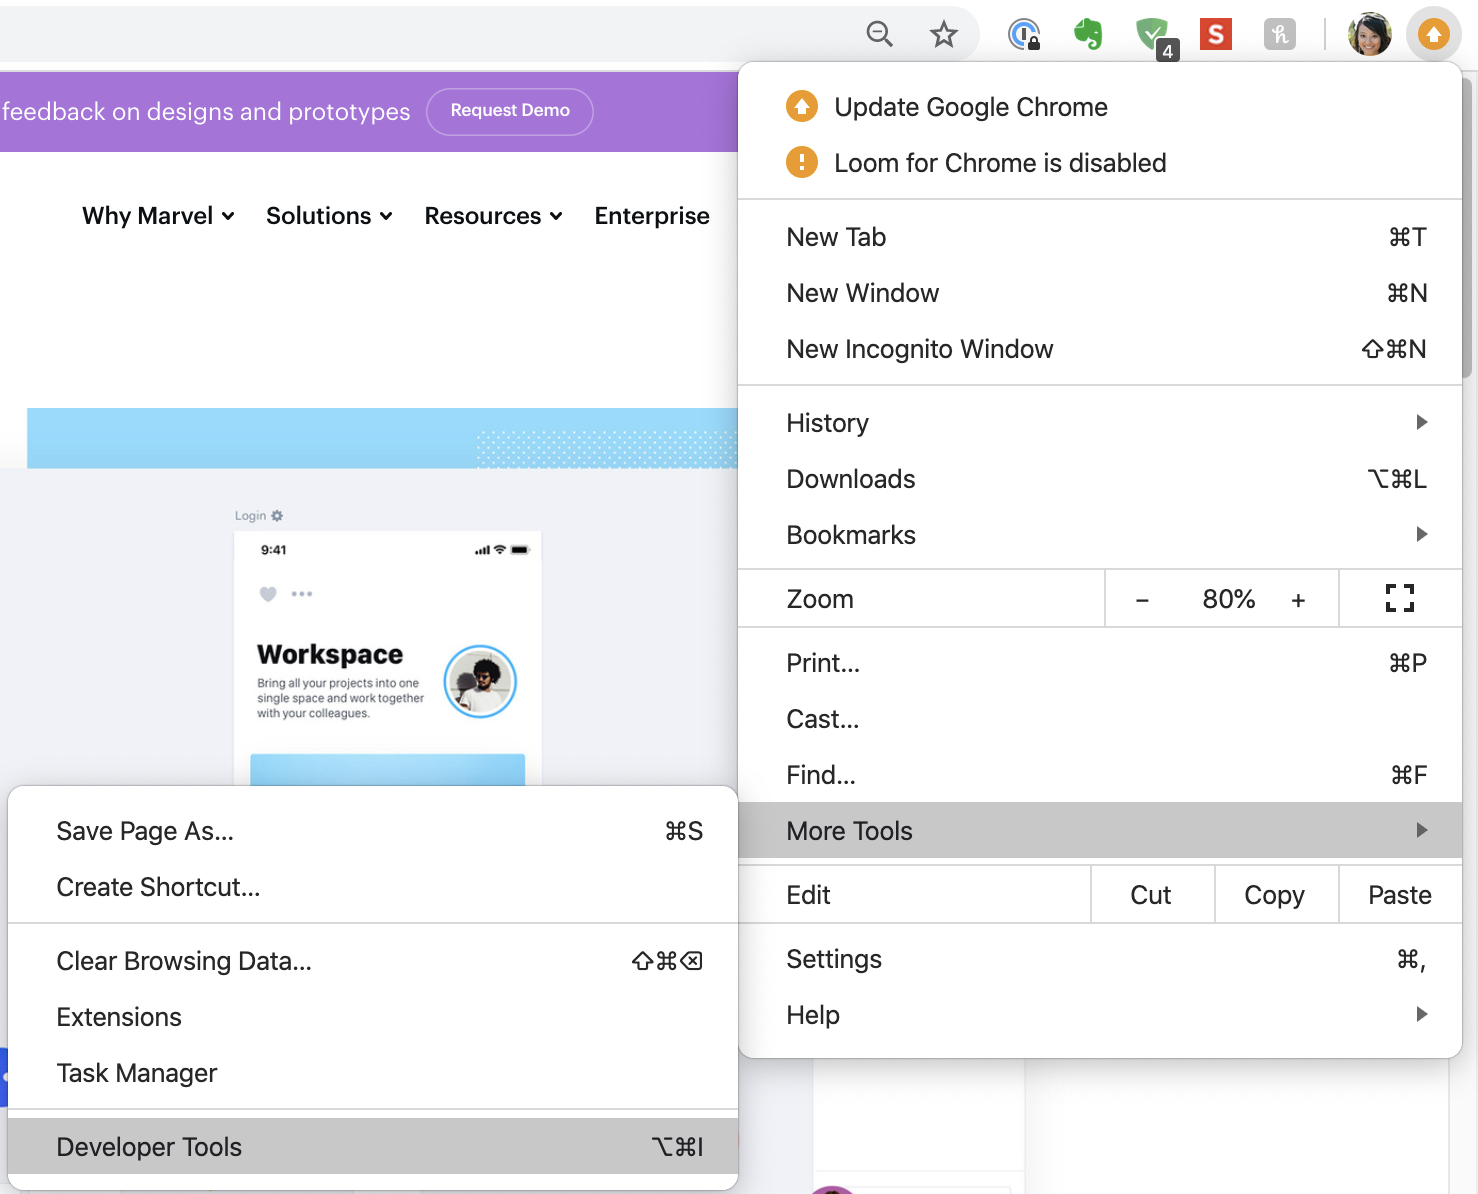
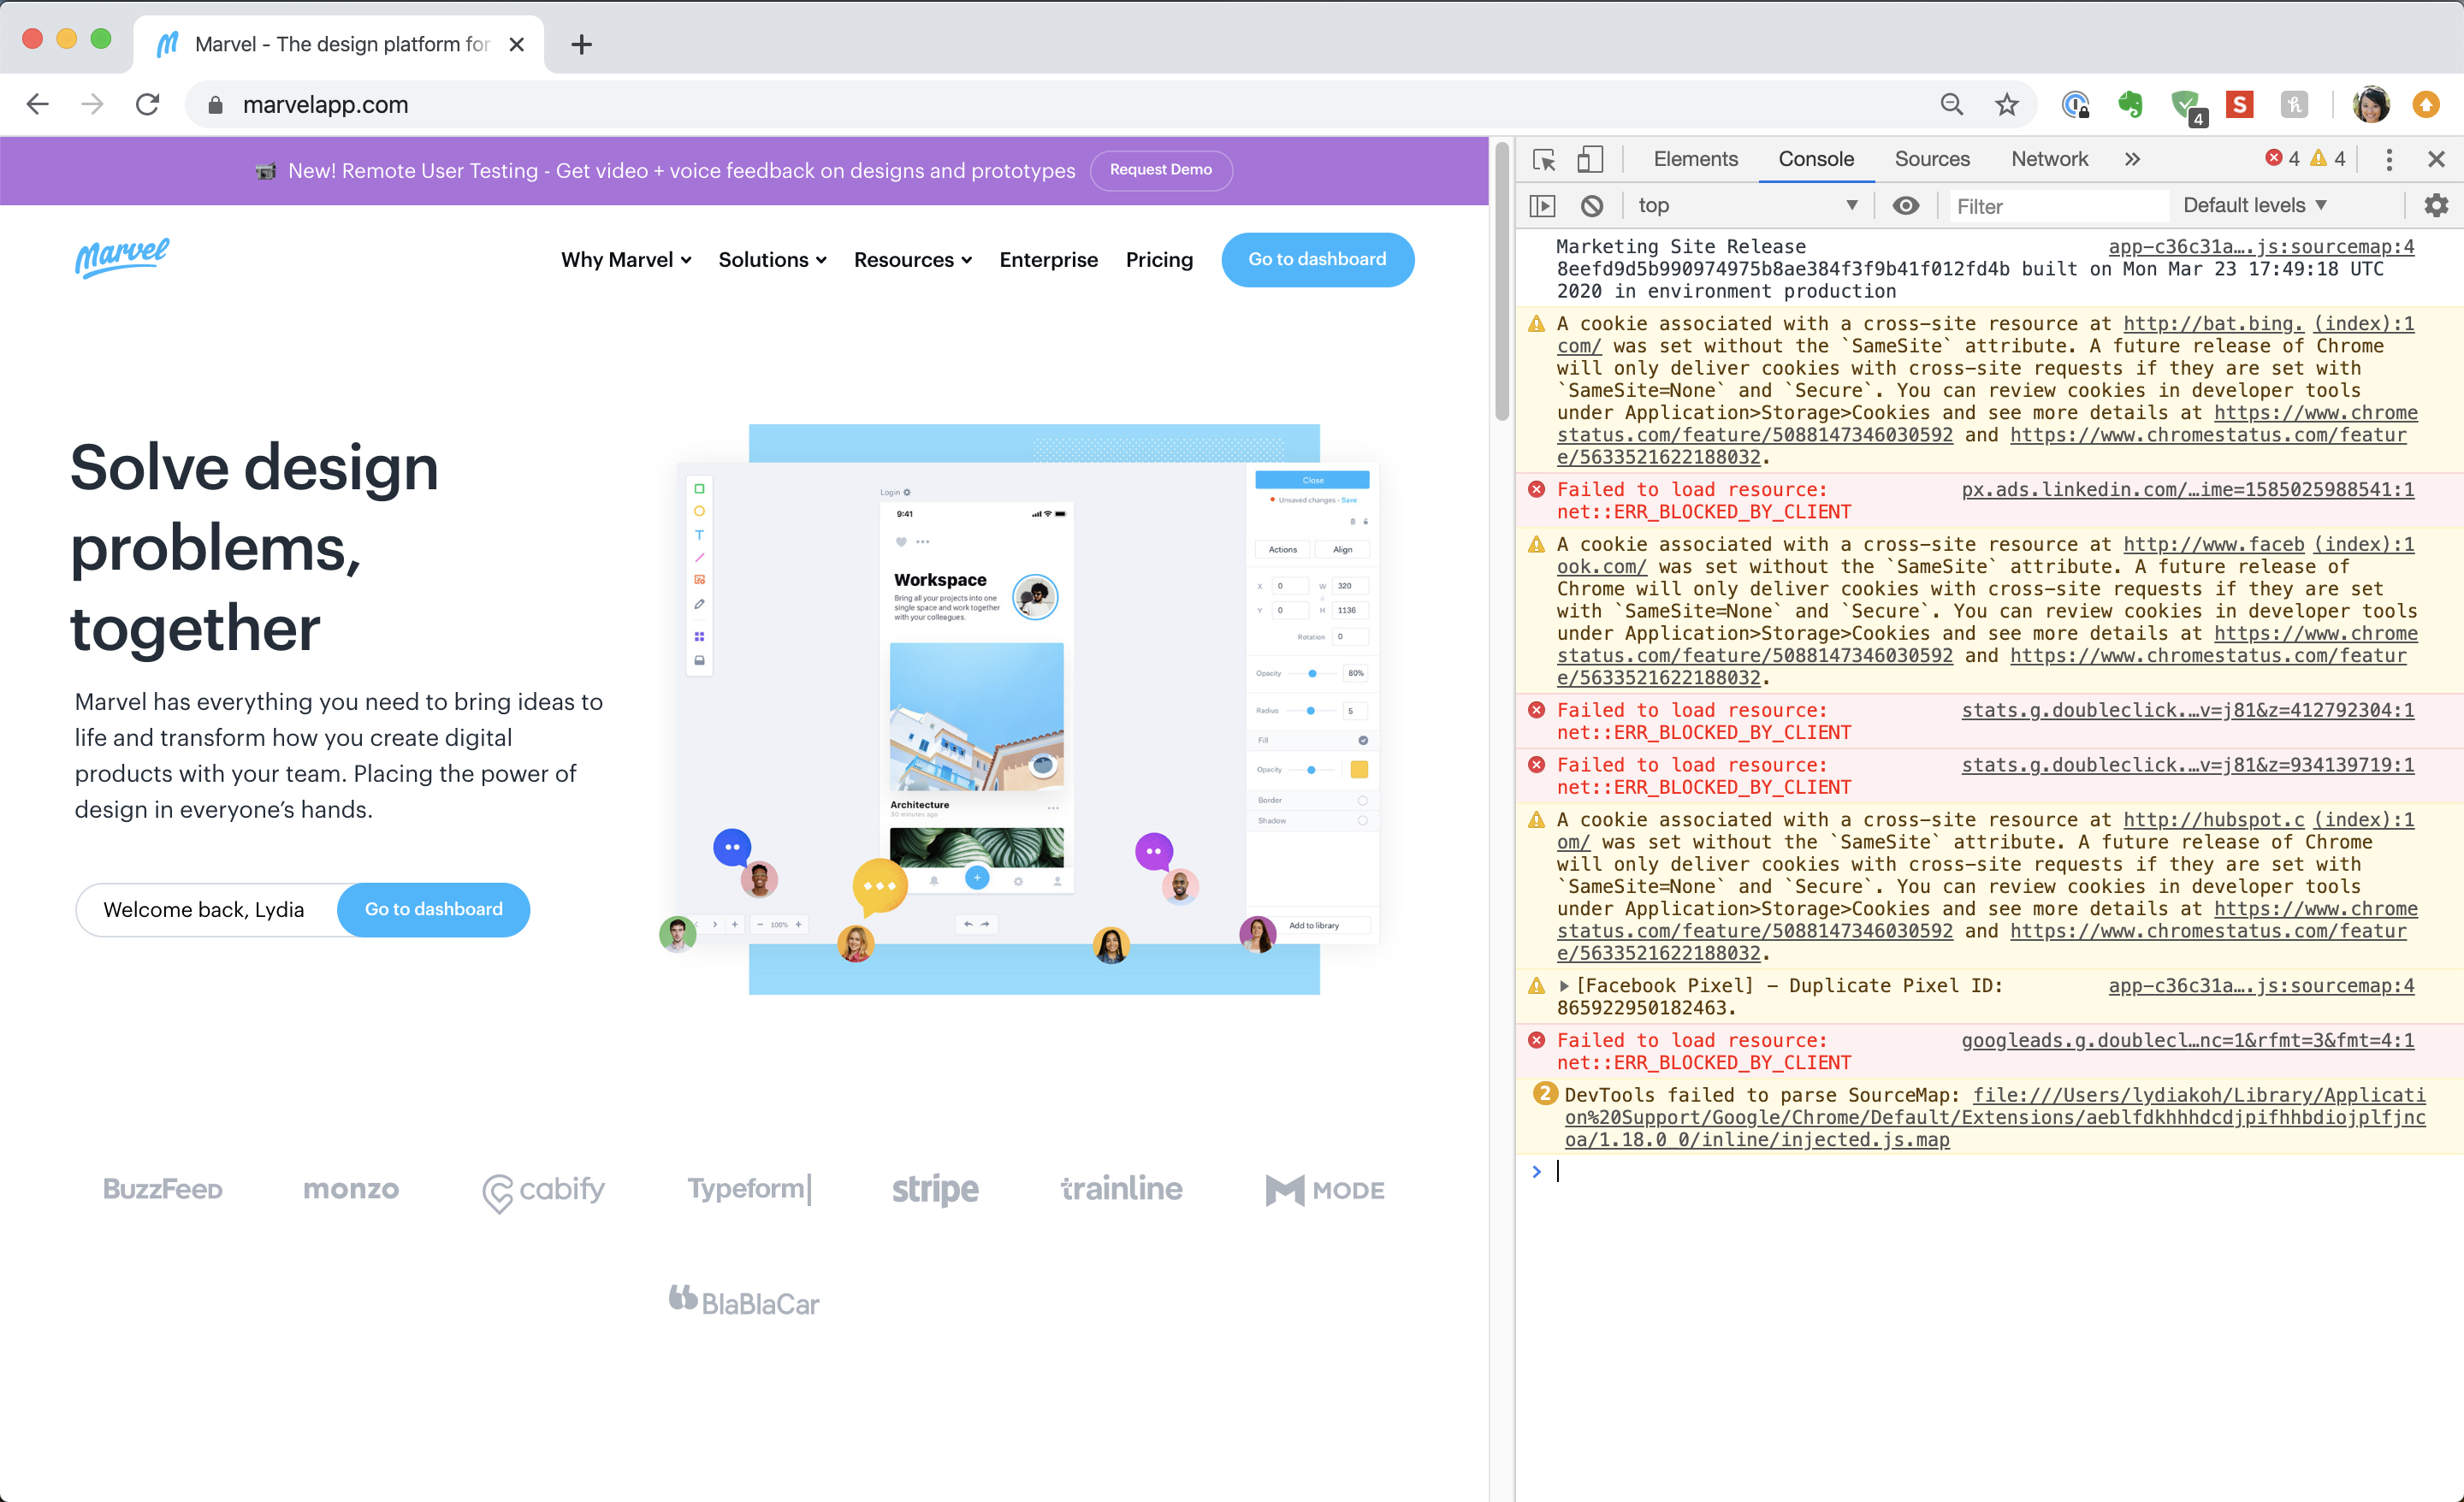
The console will look like this:
How to open the developer console in Safari
1. Open Develop menu by going to Safari > Preferences > Advanced > Check "Show Develop menu in menu bar."
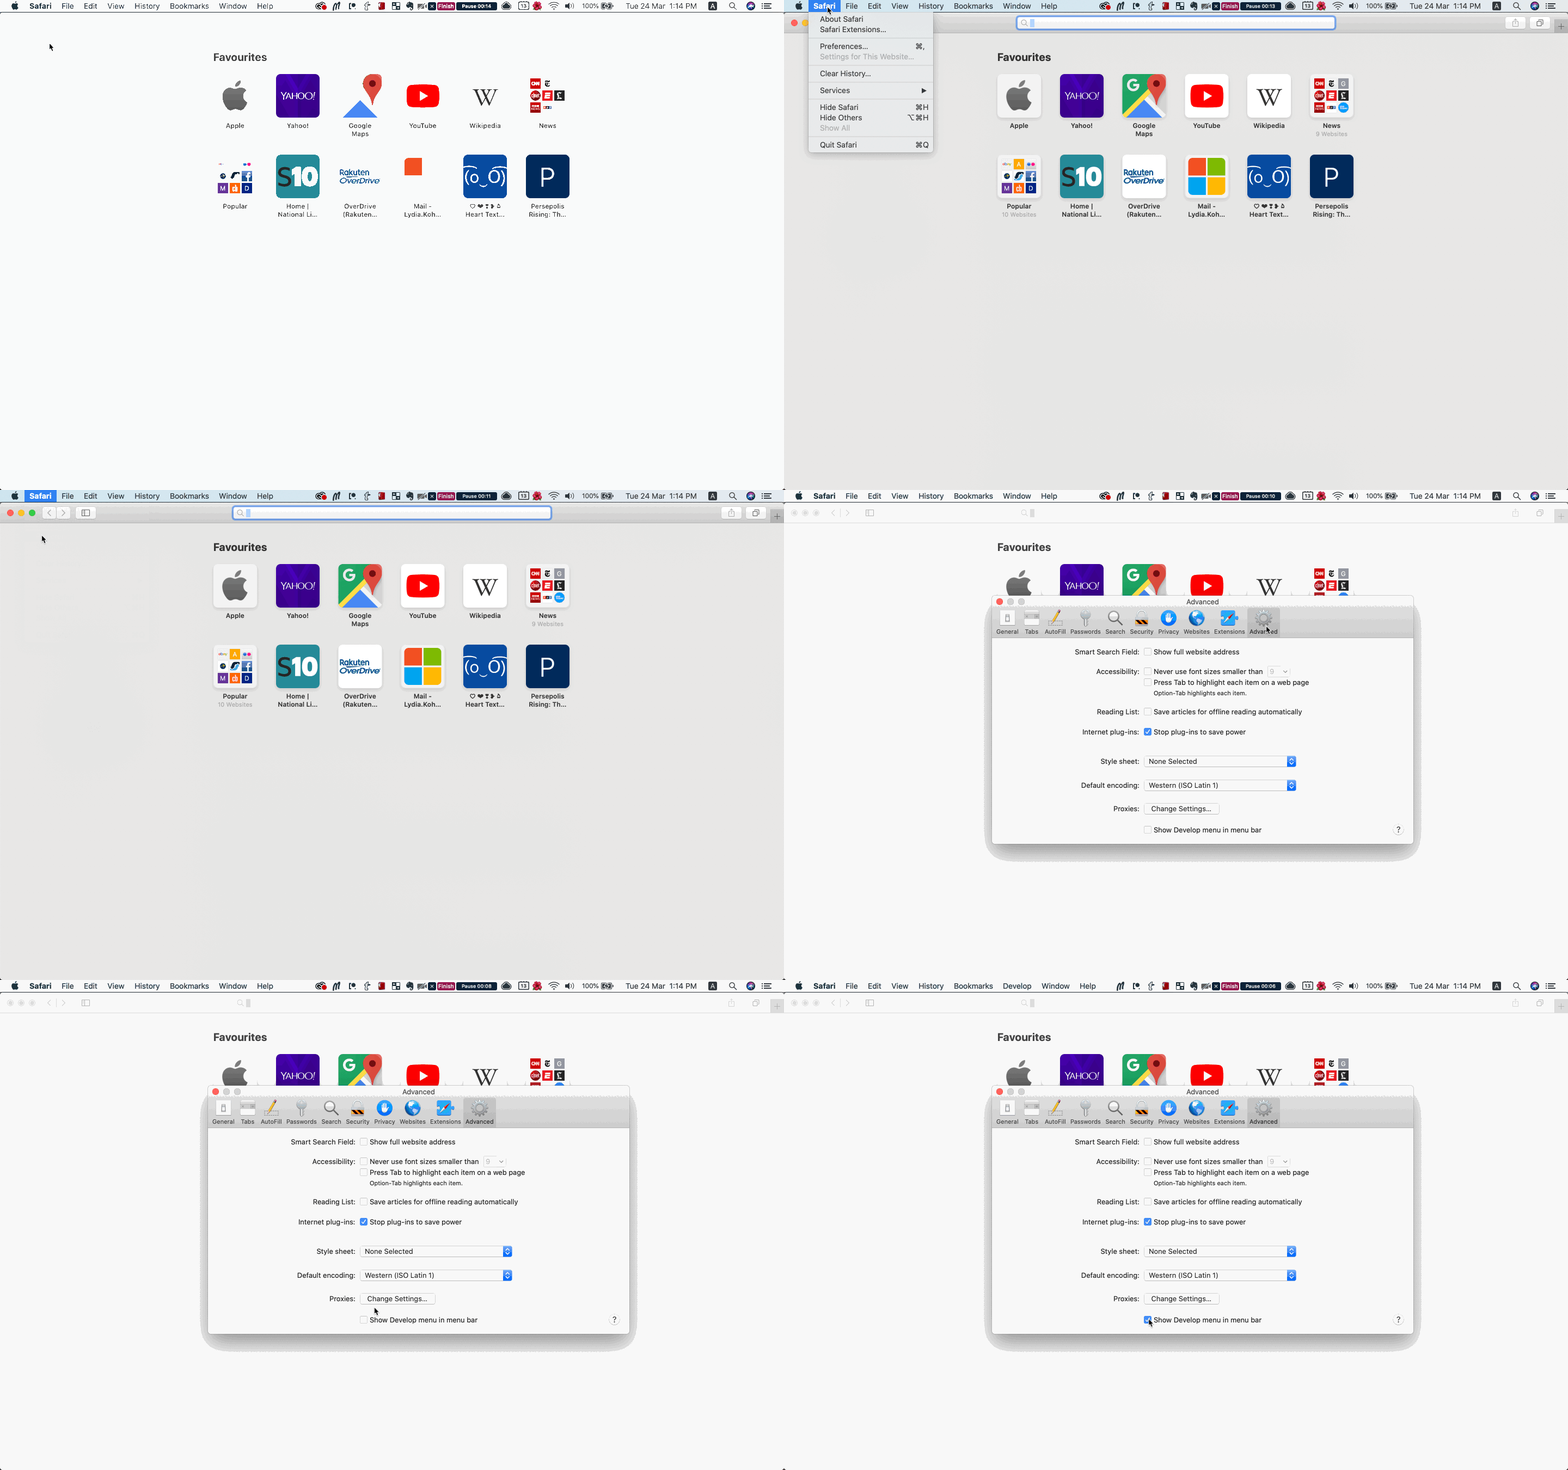
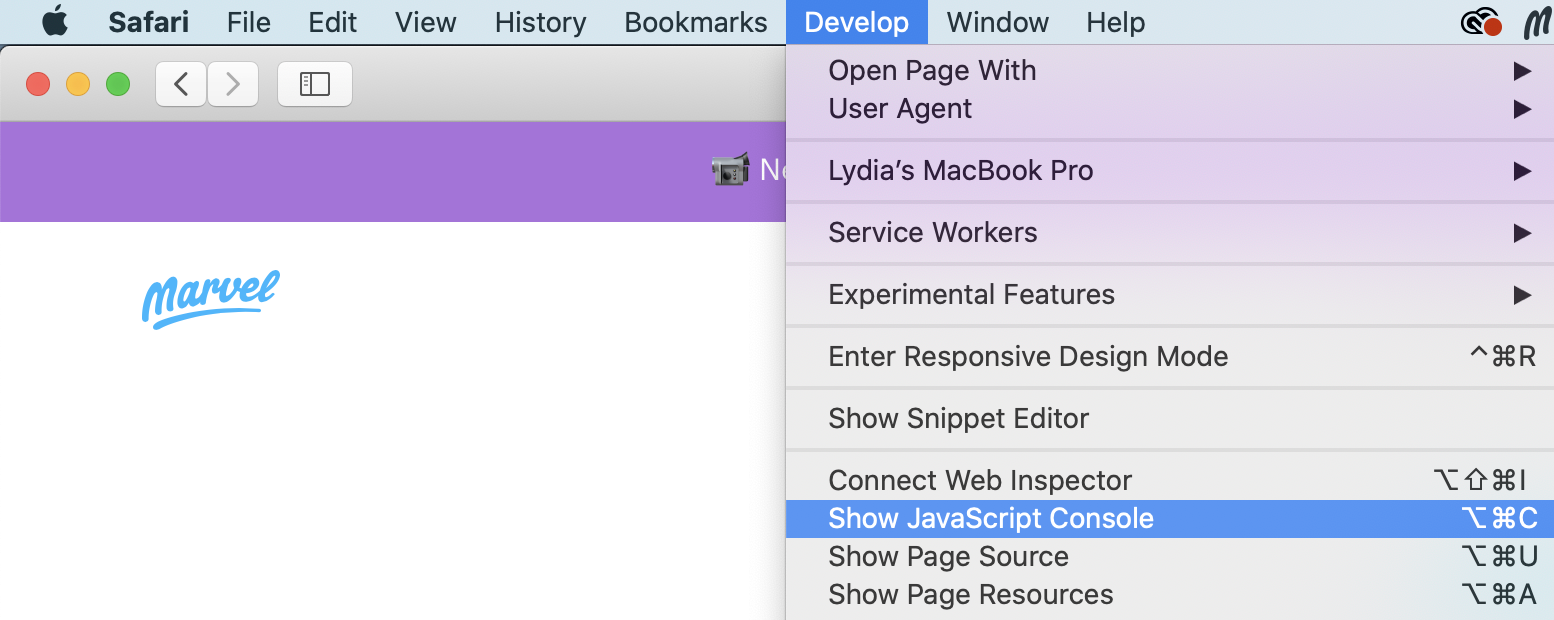
2. Use the keyboard shortcut Option + Cmd + C to open the console.
OR
Go to the Safari toolbar > Develop > Show Javascript Console.
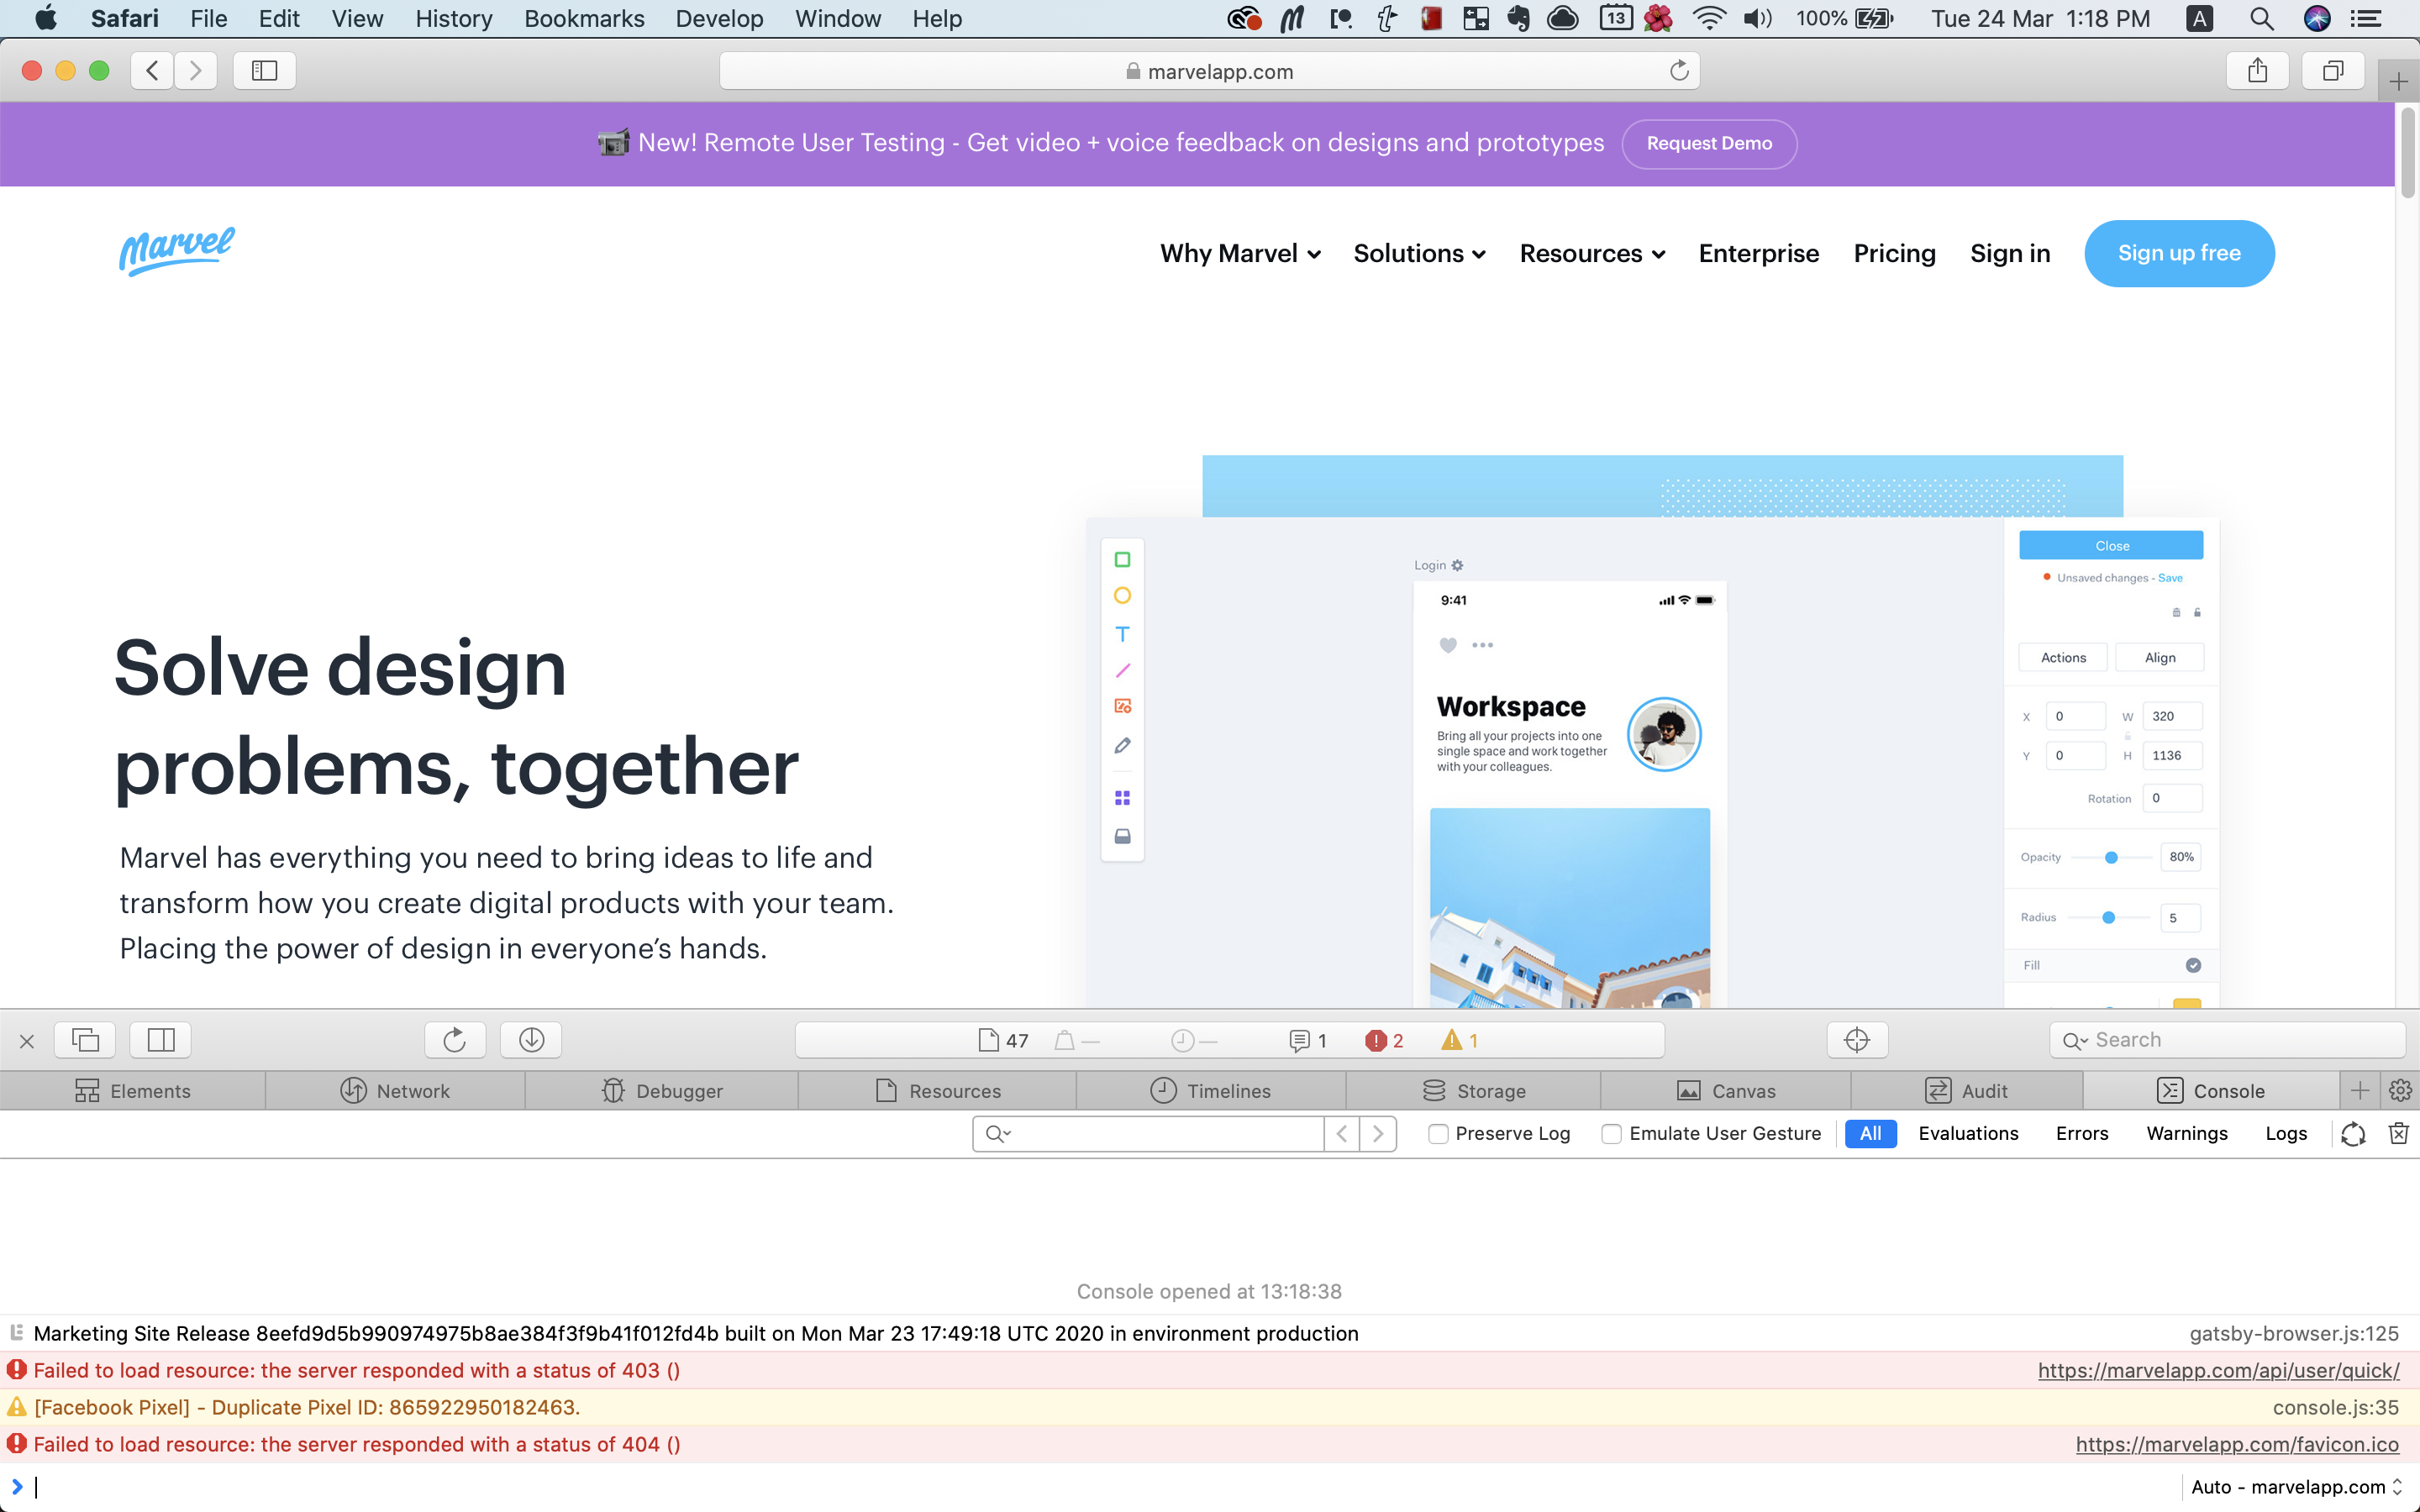
The console will look like this:
How to open the developer console in Firefox
Use the keyboard shortcut Cmd + Shift + K (on Windows) or Cmd + Option + K (on Mac).
OR
Go to the Firefox Menu (upper right-hand corner) > Web Developer > Browser Console.
The console will appear in a new window:
